Description
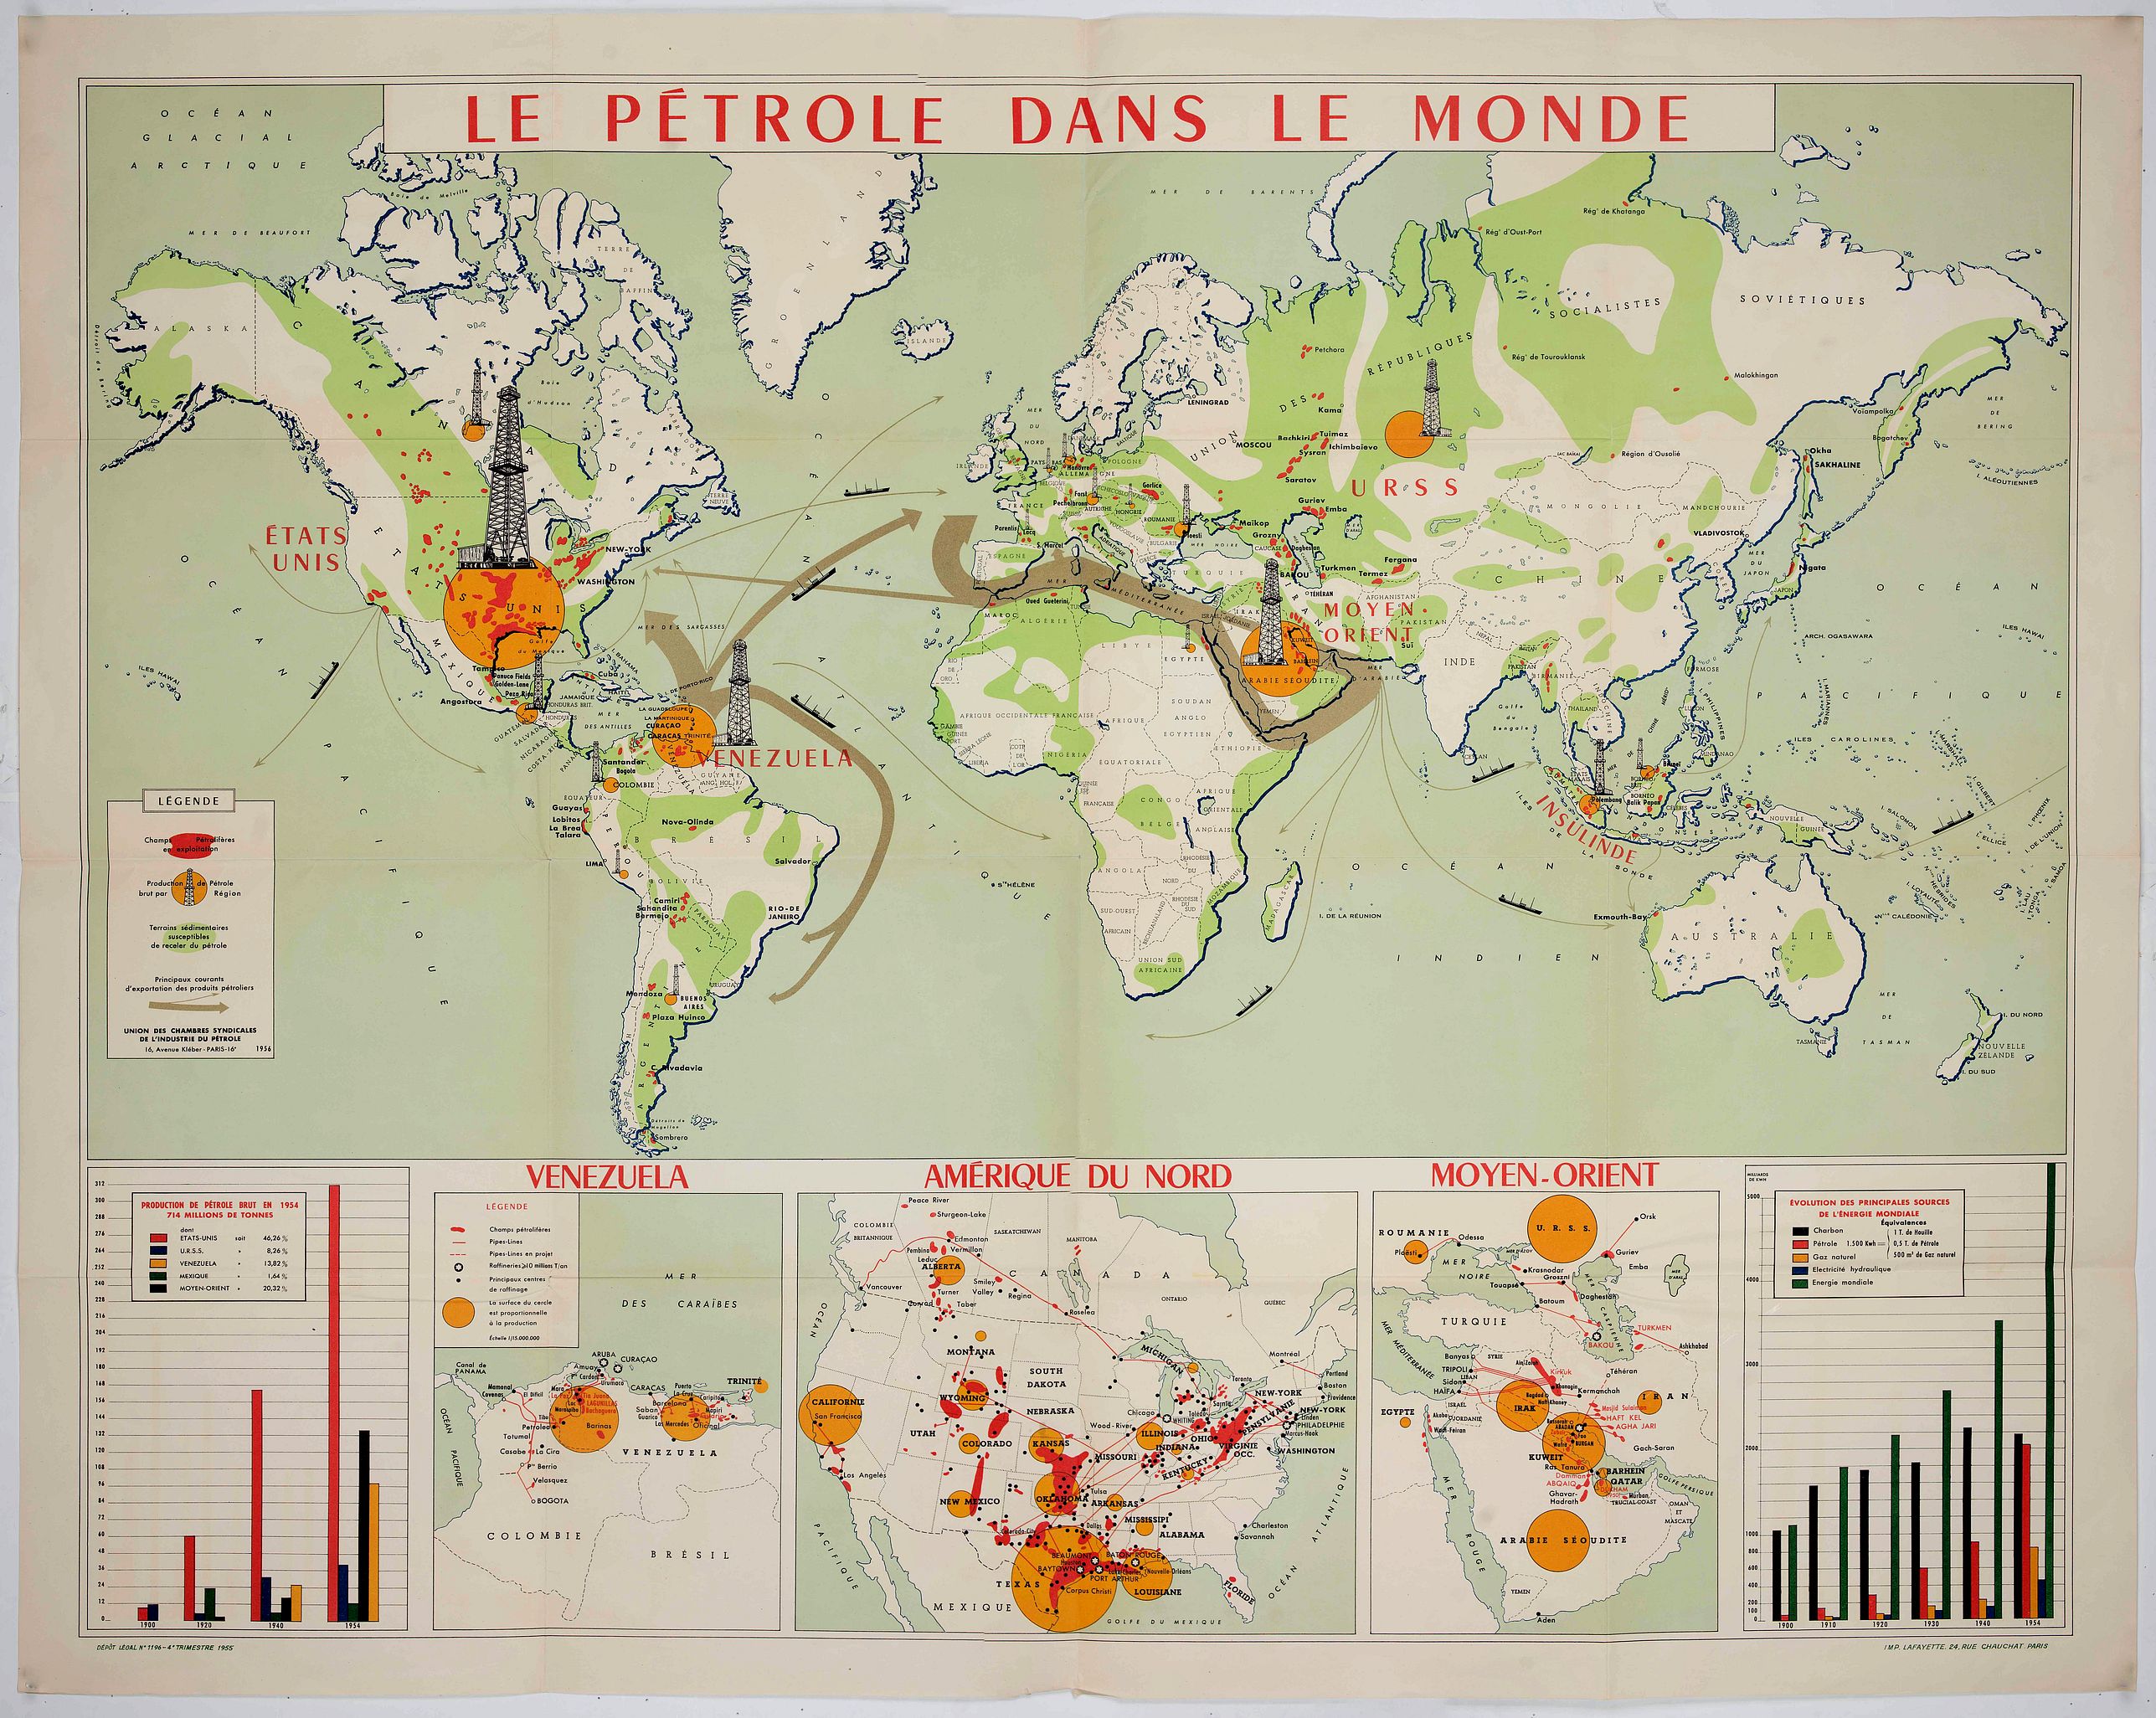
The main map provides an overview of the production and transport of crude oil around the world. Regions shaded bright red represent fields “in exploitation”, those shaded green are likely to contain oil reserves, and orange circles and drilling-rig symbols are sized in rough proportion to the output of the major oil-producing countries.
Gray arrows indicate the main sea lanes by which crude oil was shipped; using the “flow map” technique pioneered a century earlier by Charles Joseph Minard, the arrows are sized in proportion, more or less, to the volumes of oil transported on each route.
Below the main map three insets provide detailed depictions of three of the four main oil-producing regions: Venezuela, North America and the Middle East (The fourth region, the Soviet Union, is not so treated, perhaps because at the time it was minimally integrated with the global economy.) As on the main map, red shading indicates active oil fields, and orange circles indicate volume of production in different regions. In addition, small black circles and larger black stars indicate refineries, while red lines delineate the routes of pipelines.
A chart at lower left indicates how the volume and location of oil production had changed between 1900 and 1956, while a similar chart at lower right demonstrates the growing importance of oil in the overall energy “mix” during the same period (Naturally, “renewables” are nowhere in evidence.) Finally, a small inset map at center left depicts the impact of Abdul Nasser’s closer of the Suez Canal in late 1956 on the global flow of crude oil.
A present-day map of crude oil production would look rather similar: The United States, the Mideast and Russia remain the top oil producers, though Venezuela’s near-total collapse has greatly reduced its role in the market. Conversely, Brazil, China and Norway, among others, which have no presence on this 1958 map, have in recent decades become significant producers of crude oil, while of course Japan, China and the countries of Southeast Asia have all become major consumers.
The map was published by the Union des Chambres syndicales de l’industrie du pétrole, an association of trade unions in the French petroleum sector established in 1944. Not named, but I assume integral to the workings and funding of the Union, was the French multinational Total (formerly CFP), founded in 1924 and today considered one of the seven “supermajor” oil companies. [source : Boston Rare Maps].
Reference: OCLC 12625662 et al, giving six institutional holdings worldwide.
FAQ - Guarantee - Shipping
Buying in the BuyNow Gallery
This item is available for immediate purchase when a "Add to Cart" or "Inquire Now" button is shown.
Items are sold in the EU margin scheme
Payments are accepted in Euros or US Dollars.
Authenticity Guarantee
 We provide professional descriptions, condition report and HiBCoR rating (based on 45 years experience in the map business)
We fully guarantee the authenticity of items we sell. We provide a certificate of authenticity for each purchased item.
Condition / Coloring
We indicate the condition of each item and use our unnique HiBCoR grading system in which four key items determine a map's value: Historical Importance, Beauty, Condition/Coloring and Rarity.
We offer many maps in their original black and white condition. We do not systematically color-up maps to make them more sellable to the general public or buyer.
Copper engraved or wood block maps are always hand colored. Maps were initially colored for aesthetic reasons and to improve readability. Nowadays, it is becoming a challenge to find maps in their original colors and are therefor more valuable.
We use the following color keys in our catalog:
Original colors; mean that the colors have been applied around the time the map was issued.
Colored; If the colors are applied recently or at the end of the 20th century, then "colored", or "attractive colors" will be used.
Original o/l colors; means the map has only the borders colored at the time of publication.
Read more about coloring of maps [+]
FAQ
Please have a look for more information about buying in the BuyNow gallery.
Many answers are likely to find in the general help section.
Virtual Collection
![]()
With Virtual Collection you can collect all your favorite items in one place. It is free, and anyone can create his or her Virtual map collection.
Unless you are logged in, the item is only saved for this session. You have to be registed and logged-in if you want to save this item permanently to your Virtual Collection.
Read More [+]
Registering Here, it is and you do not need a credit card.
Add this item to
Virtual Collection
or click the following link to see my Virtual Collection.
Invoice
The invoice and certificates of authenticity are available in the client center >Invoices
| High-Resolution Digital Image Download | |
|
Paulus Swaen maintains an archive of most of our high-resolution rare maps, prints, posters and medieval manuscript scans. We make them freely available for download and study. Read more about free image download |
Click this image for a free HR-image download. |
In accordance with the EU Consumer Rights Directive and habitually reside in the European Union you have the right to cancel the contract for the purchase of a lot, without giving any reason.
The cancellation period will expire 14 calendar days from the day after the date on which you or a third party (other than the carrier and indicated by you) acquires, physical possession of the lot. To exercise the right to cancel you must inform Paulus Swaen Europe bv, which is offering to sell the lot either as an agent for the seller or as the owner of the lot, of your decision to cancel this contract by a clear statement (e.g. a letter sent by post, or e-mail (amsterdam@swaen.com).
To meet the cancellation deadline, it is sufficient for you to send your communication concerning your exercise of the right to cancel before the cancellation period has expired.